Mixed-method UXR for user-centered prioritization
There’s always something to do. There’s usually too much to do, all at once. I bring data and user-centered research to help teams discover outcome-based, useful prioritization.
Prioritization to reduce risk at HHS ASA
My team was asked by HHS ASA to help them develop Internal Control Metrics (ICM): tools to measure and evaluate the effectiveness of their internal controls for risk management.
No part of HHS had ever built nor implemented ICM, so we were starting from scratch to modernize their business practices. HHS had no prior processes to identify and mitigate risks.
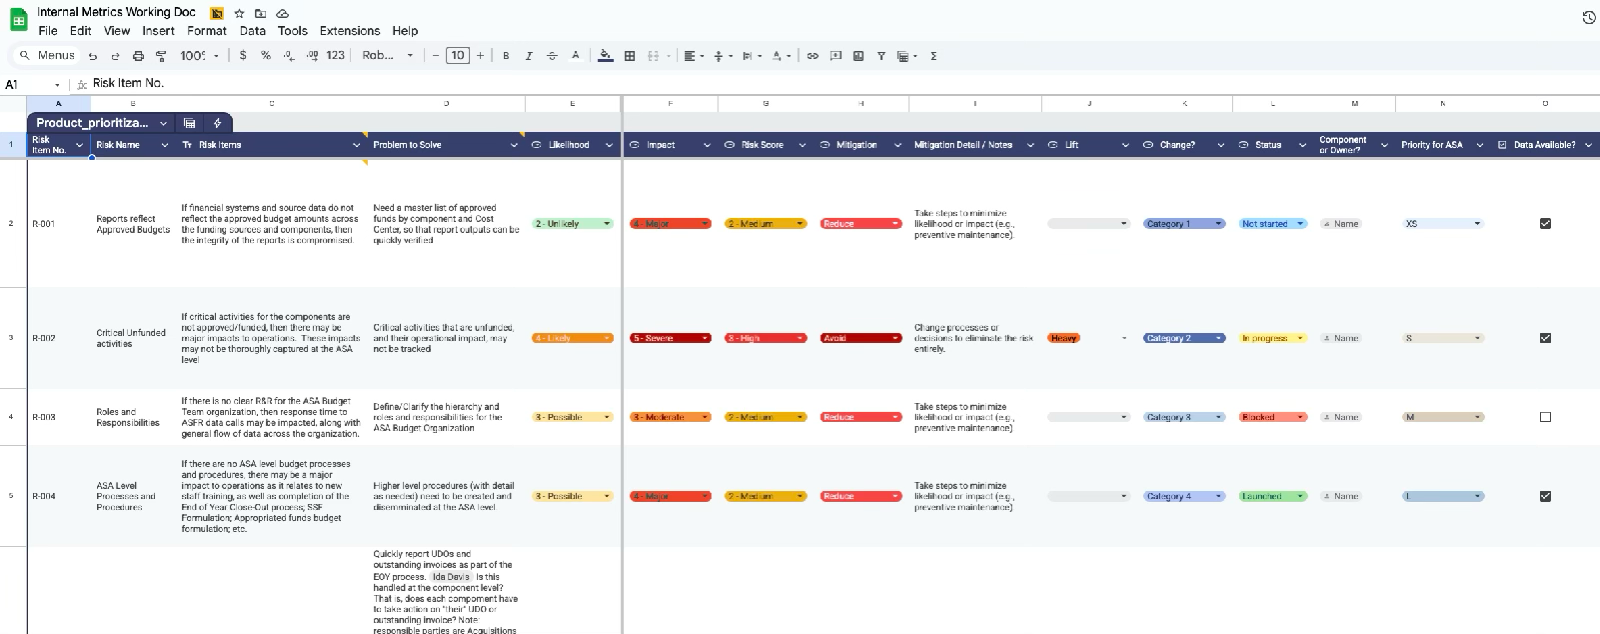
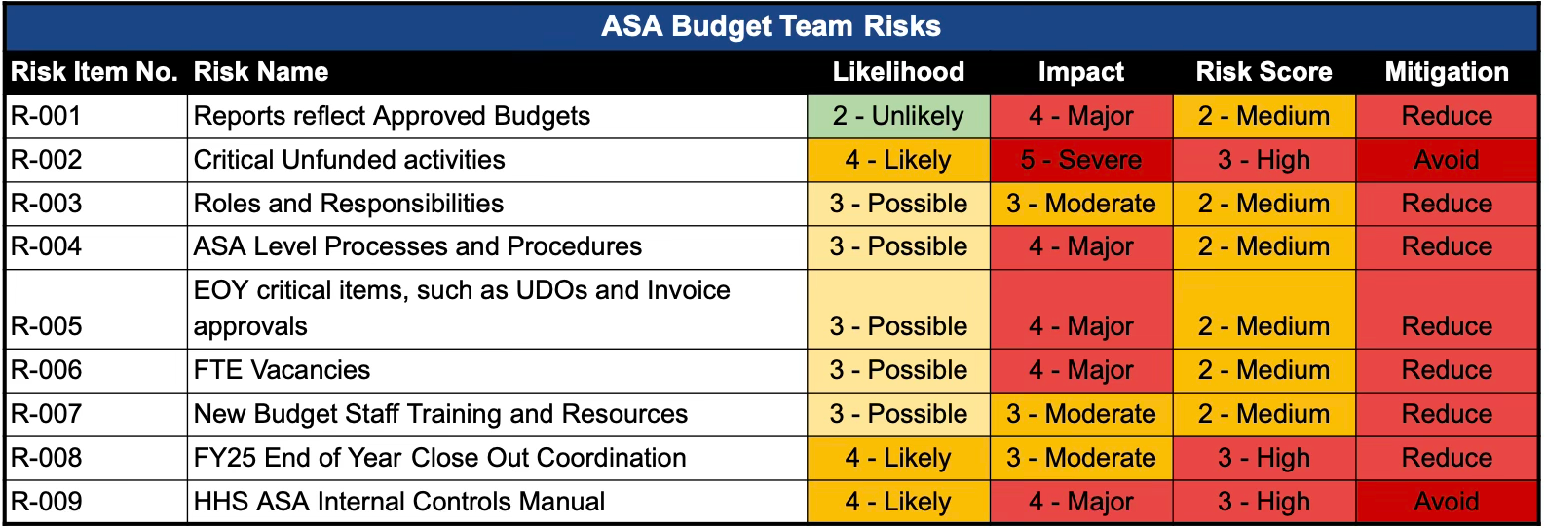
I was able to parse which risks from the GAO Green Book were relevant to budgeting, and built a spreadsheet to track each risk, categorize it (what the problem is in plain language, likelihood, severity, and other factors), and create status flags for each risk. In this I was joined later by a budget SME.
This allowed us to build an easy-to-understand and easy-to-update dashboard for "risk score" and prioritization of addressing risks. The ASA leadership was enthusiastic and adopted it, and it was in active use while I was on the contract.
User research to prioritize features at Open Garden
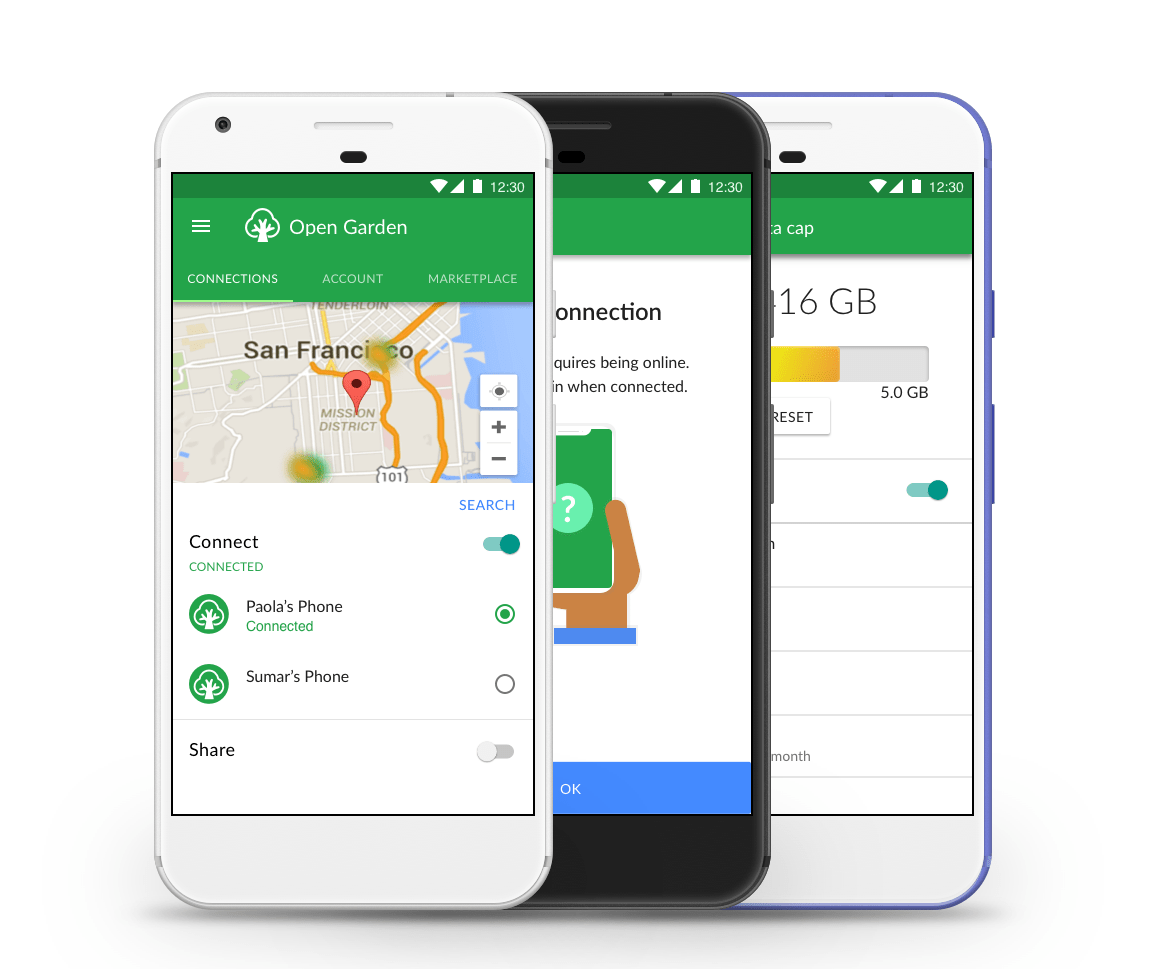
As Lead Designer at Open Garden, I worked with my Lead Developer to identify the most critical drop-off points for users. We agreed that the largest adoption issue was that users were not making it past the initial screen, which in the alpha version of the app, showed a list of alphanumeric access points (like a WiFi access point list) with no other information. Guerrilla usability testing confirmed that this UI sparked distrust in the quality and availability of all connections (users asked how close and how strong the connections would be), creating distrust in the app.
I saw my responsibility to prioritize that design issue before working on new, less critical features.
Through a combination of competitive analysis and more testing with interactive prototypes, I gathered enough data to show leadership that a map-based interface (top image) would:
reduce app abandonment (win for business goals)
require a small investment in design and development time (relatively low cost compared to user adoption gain)
create a better emotional connection between Open Garden users and Open Garden (qualitative results from testing)
Through a mix of guerrilla and structured, in-person rapid usability testing, I checked each feature prototype with a representative range of user types. Testing within the company was not a viable option: everyone there was invested in building the app, so they did – or should – know how it worked already.
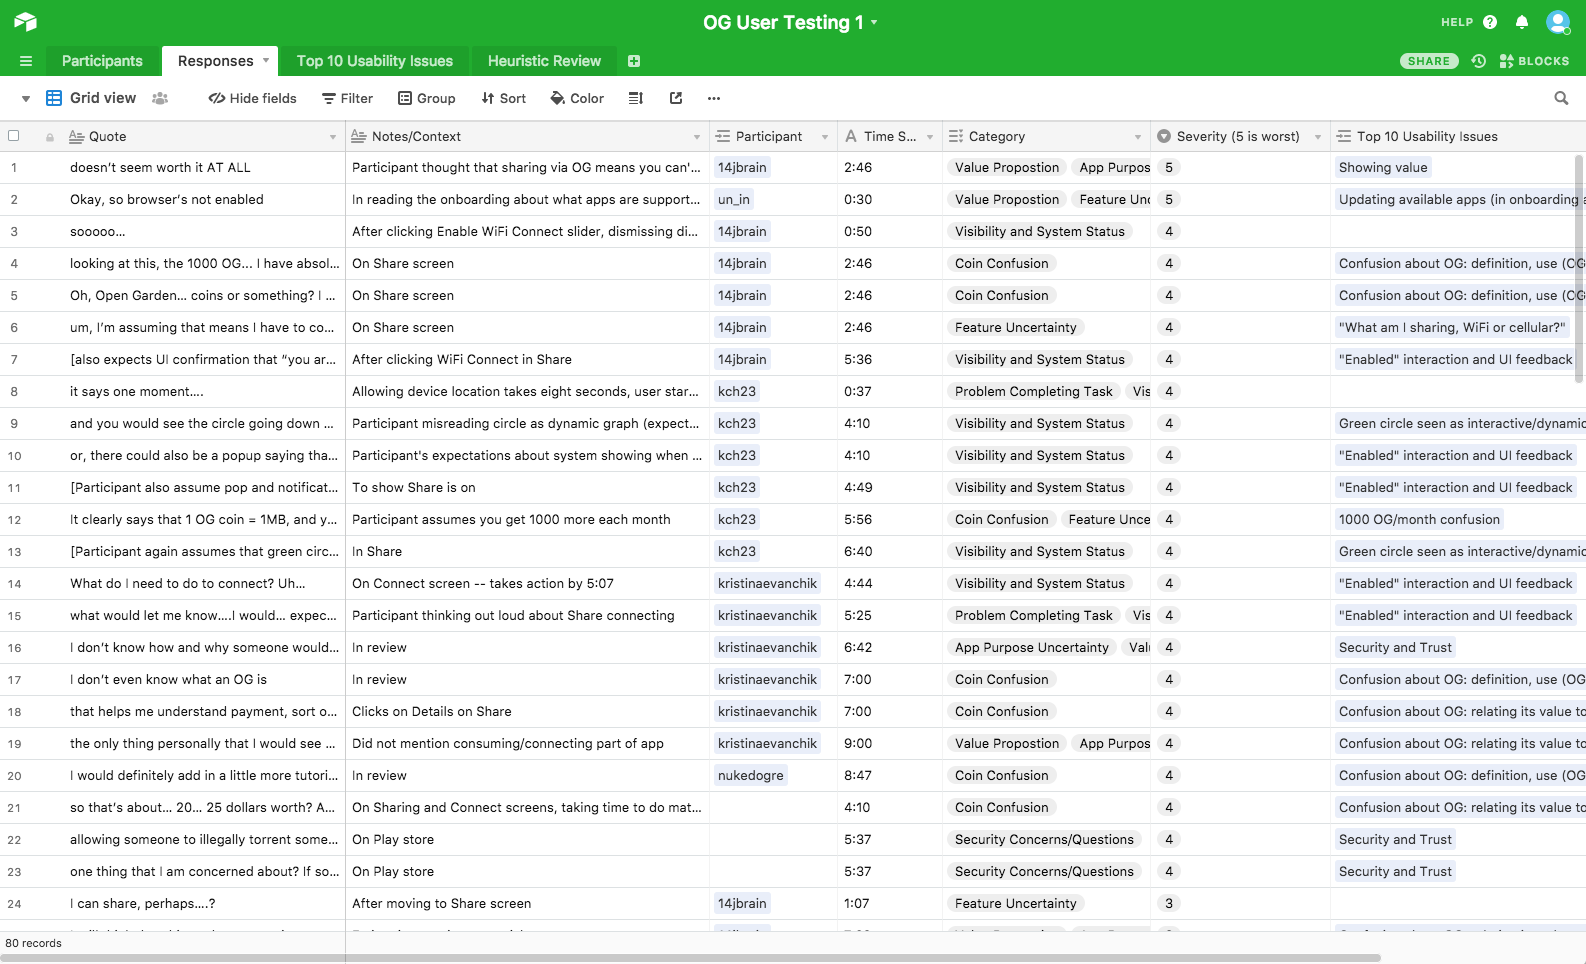
Using combinations of paper prototyping, InVision on mobile, and live code in moderated sessions, I compiled the qualitative data in Airtable (bottom image). This allowed me to share my findings, stack rank problems that needed to be addressed, and compile where our language and design was confusing for novice or experienced users. You can find the template I created for this on Airtable Universe.
Kickoffs and prototyping for prioritization
When working with Potato for Google’s Fulfilled by Google product, two critical opportunities for initial and revised prioritization arose: our initial kickoff meeting with the client, and in co-design-coded paper prototyping with stakeholders and users.
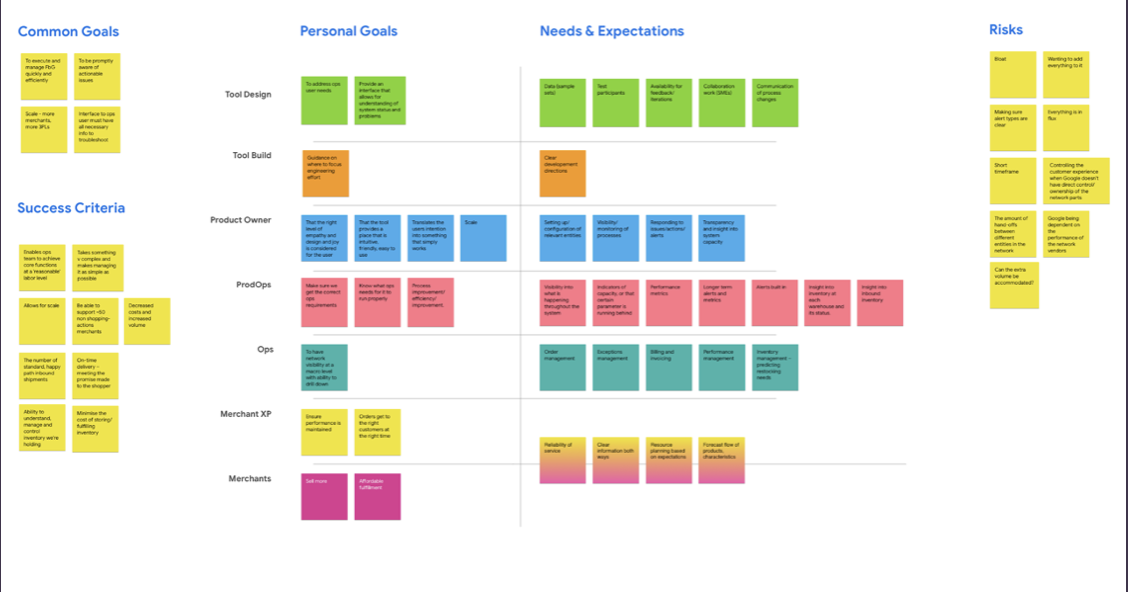
At the kickoff meeting, which I co-facilitated with my team’s Product Owner, we encouraged the stakeholders to brainstorm what they saw as the project goals for actors in the system (from Google to the teams building the product to merchants) as well as each actor’s needs and expectations.
As we collaboratively organized and simplified these thoughts, we also pulled out what might success look like for these actors, as well as risks, and how we could think about common goals (top image).
This helped up build our Statement of Work (SoW) and map out, internally, what kind of research we needed to do, with whom, and in what order, as well as know when we could move to our next phase of design.
In that later phase, we organized paper prototyping sessions (bottom image) with both stakeholders and users of the product, based on the IA we’d developed (see the full-project case study for more details).
This not only helped us uncover where our initial work was not meeting user needs, and what work we needed to do next, but also increased buy-in and enthusiasm from stakeholders, When they see and feel what’s going on, and can contribute, you have an ally.